Pull up two real estate sites and search "North Kansas City" and you will get two very different answers. One shows a median sale price of $340,000 over the three months ending in April 2026, up 22.4 percent from the year before. The other shows a trailing twelve-month median of $500,990, up 11 percent. That is a gap of roughly $160,000 for the same four-square-mile city.
Neither number is wrong. Neither site made a typo. What you're looking at is what happens when a real market gets small enough that the math itself starts to wobble. If you're comparing North Kansas City to Parkville, Platte City, or anywhere else in the Northland, you need to understand why that wobble happens before you trust any single figure on a screen.
The Gap, Side By Side
Here's what each source actually reported:
| Source | Time Window | Median Sale Price | Change Year Over Year |
|---|---|---|---|
| Citywide sales data | 3 months ending April 2026 | $340,000 | +22.4% |
| Trailing 12-month data | most recent 12 months tracked | $500,990 | +11% |
You could spend an afternoon trying to reconcile the methodology behind each number, different windows, different ways of drawing the city's boundary, different sample dates. The more useful question is why a market this size lets two reasonable data feeds land nearly half again apart in the first place. The answer has nothing to do with either source being sloppy. It has to do with how few homes actually change hands here in any given stretch.
The Contradiction Inside The Same Data Set
The clearest tell isn't the gap between two websites. It's a contradiction inside a single one.
Over that same three-month window ending April 2026, the median sale price rose 22.4 percent. In the exact same period, the median sale price per square foot fell 7.9 percent. Those two numbers cannot both describe genuine appreciation. If the typical home is selling for more money but each square foot inside it is worth less, the honest read is that bigger homes closed this period, not that the existing housing stock got more valuable.
I spent years managing budgets and schedules before I started selling homes for a living, and if a cost report crossed my desk showing total spend up 22 percent while unit cost dropped 8 percent in the same reporting period, I would have sent it back before the meeting started. Somebody needs to explain what changed in the mix, not just report the top-line number and move on.
Here's what changed in the mix. Only nine homes sold in North Kansas City in April 2026, down from eleven the year before. Days on market jumped to 42, up from 17. A median built from nine transactions can move when one of those nine changes. One larger new-construction closing, one recently renovated bungalow, one estate sale, and the whole citywide median can swing by tens of thousands of dollars without a single existing home in town actually gaining or losing value. That's not manipulation. It's arithmetic working exactly the way arithmetic works when the sample is this thin.
One Possible Source of Change in That Small Pool
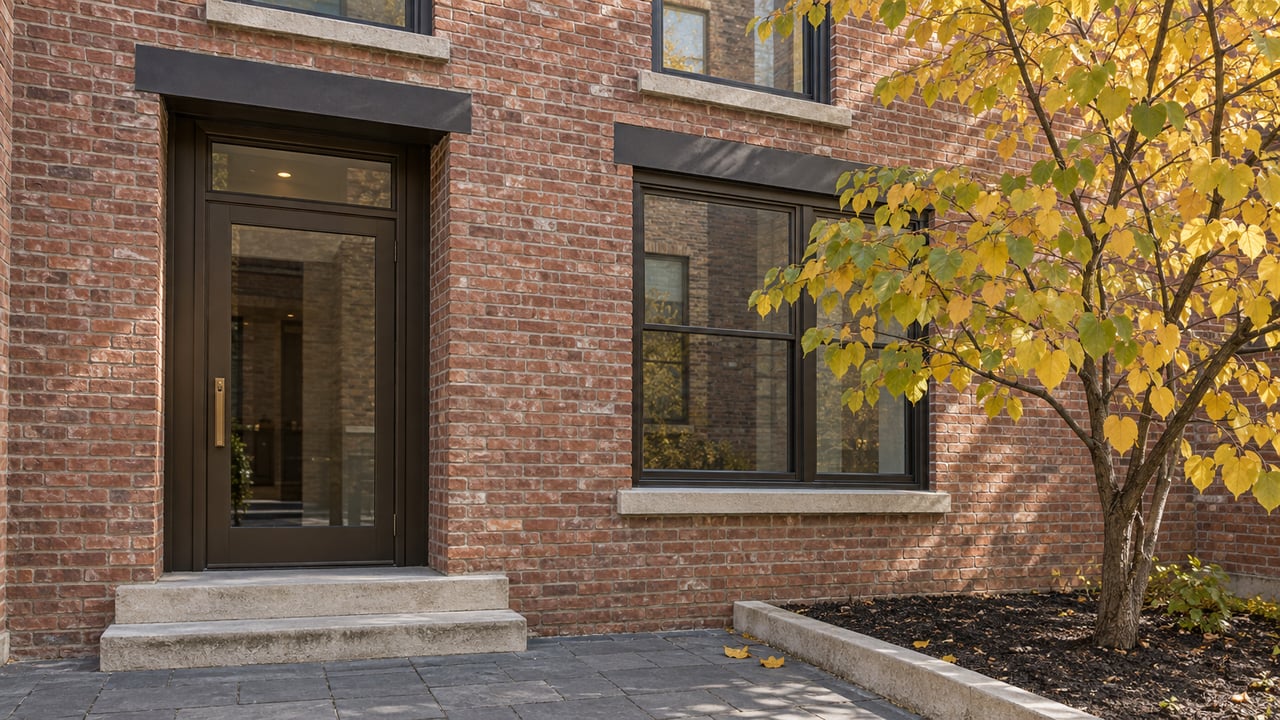
One possible contributor to a changing mix is Northgate Village, a 91-acre master-planned redevelopment from Hunt Midwest at E. 32nd Avenue and Swift Street, inside the city limits. The project includes more than 200 lots for single-family homes, patio homes, and rowhomes, along with 94 maintenance-provided rowhomes with attached two-car garages. The Urban Land Institute named Hunt Midwest a Developer of Distinction for the project, one of the region's early neo-traditional infill redevelopments built entirely on land the city hadn't had available for new housing in decades.
Northgate Village sits within walking distance of Macken Park, historic North Kansas City High School, downtown North Kansas City, and the Waggin' Trails off-leash dog park. Model rowhomes are available to tour through an on-site sales office that happens to operate through my own brokerage, ReeceNichols.
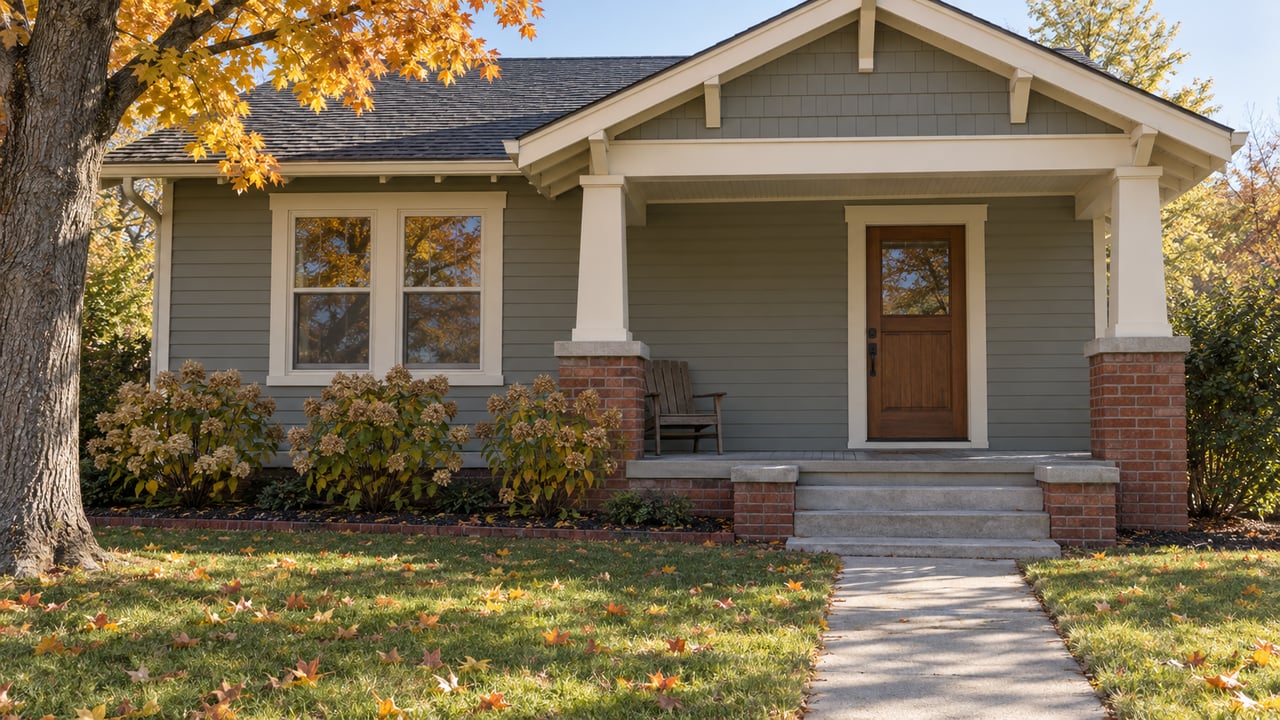
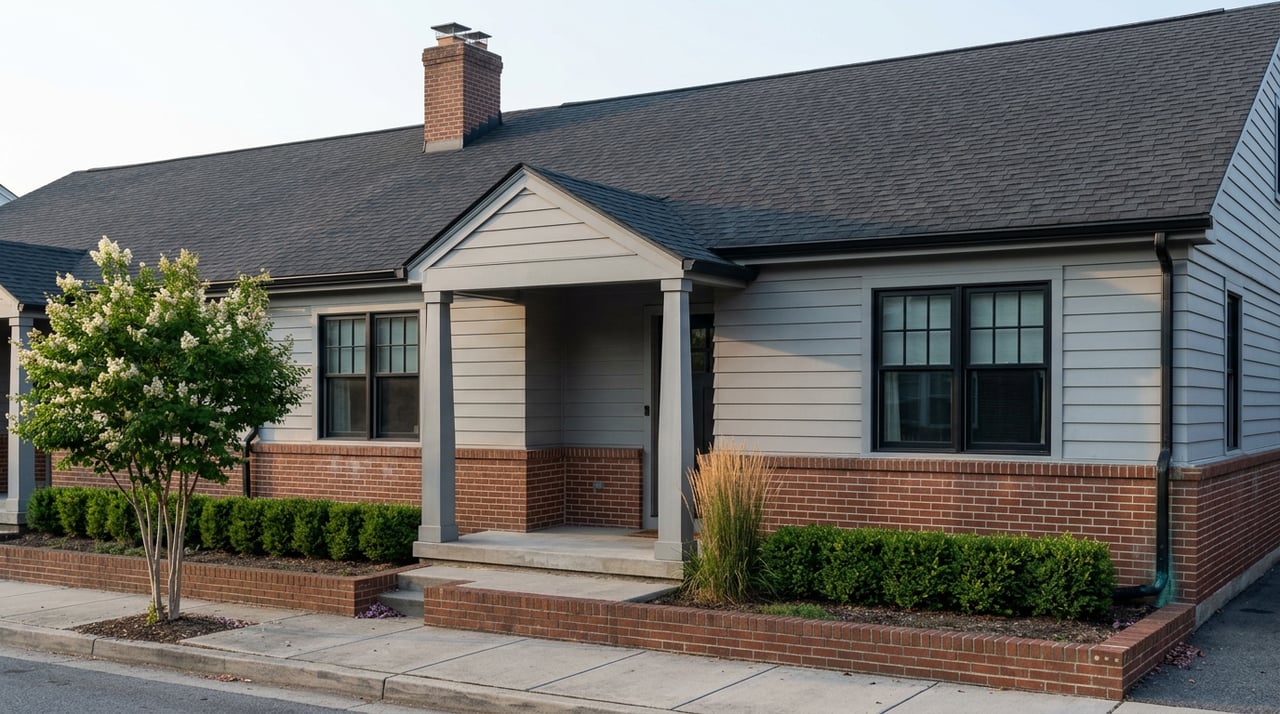
Picture a month where two or three of those new rowhomes close alongside a couple of older ranch homes near Armour Road. The rowhomes carry higher price tags and, in some cases, smaller footprints than the neighborhood's historic bungalows and craftsman-style homes. Blend a handful of each into a median built from nine total sales, and one possible result is that the headline price climbs while the price per square foot slides. If new construction enters the sample, it could move the whole number, without indicating what a 1940s bungalow three blocks away is actually worth today.
What To Actually Track If You're Comparing Neighborhoods
If you're weighing North Kansas City against another Northland community, the citywide median is the least reliable number on the page. Here's what holds up better:
- Price per square foot over a full year, not a single quarter. It smooths out the effect of one or two unusual closings and tells you whether value is actually rising.
- Days on market, year over year. A jump from 17 days to 42 days in the same window the median "rose" tells you buyers aren't racing to close, whatever the headline number implies.
- Whether the recent closings are new construction or resale. If Northgate Village homes are among the recent closings, that would make the market a different animal than one where only existing homes are trading.
- Actual closed comps within a few blocks of the specific address you're evaluating. A citywide median covering nine sales tells you almost nothing about one particular street.
- The raw comp sheet, not an algorithm's summary. Ask whoever is helping you for the underlying sales, not just the number a website generated from them.
None of this requires distrusting the data. It requires knowing that a market this small needs a different reading method than a market where a few hundred homes close every month and outliers get absorbed into the average without moving it much.
A Couple of Questions Worth Asking Before You Compare
Does a 22 percent jump mean I should expect a bidding war if I make an offer here? Not based on what the data actually shows. Days on market nearly tripled over the same period the median rose, from 17 days to 42. That's not the signature of a market where buyers are racing each other. It's closer to the signature of a small sample where the mix of what sold shifted.
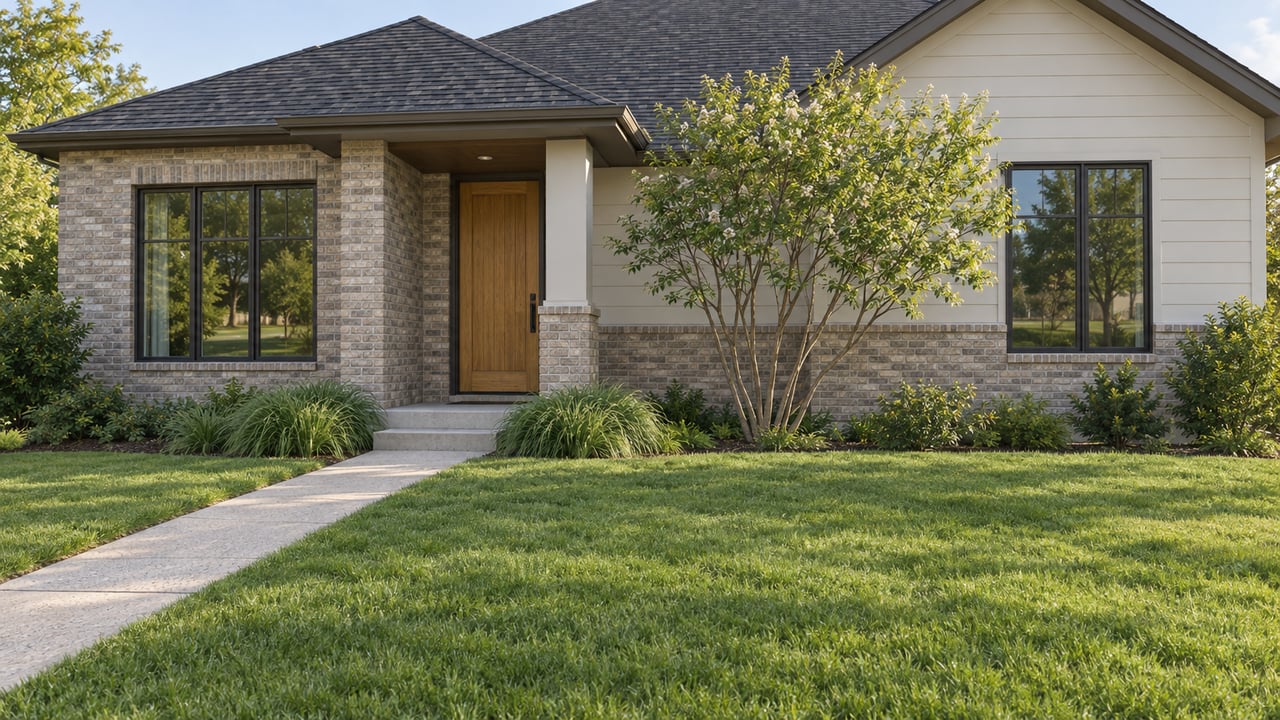
Is North Kansas City still the more affordable entry point into the Northland? That depends entirely on which product you're comparing. The city's older bungalows and ranch homes remain priced closer to the lower end of the Northland range. New construction inside Northgate Village is priced against a different bracket entirely. Lumping both into one citywide median is exactly how you end up with numbers that don't agree with each other.
Get A Number Built On The Actual Nine Houses, Not An Average Of Them
A citywide median in a market this size tells you almost nothing about what a specific home is worth. If you're comparing North Kansas City to another Northland community, or you already have an address in mind, Heather Brown will pull the real closed comps for that street, not a blended average built from nine unrelated sales, and walk you through what it actually means for your decision. Get a Free Home Valuation and start with a number you can trust.